10 KPIs You Need to Know in 2026 for Healthcare Call Centers

The 10 KPIs to track in a healthcare call center in 2026: definitions, formulas, sourced benchmarks and the new metrics for AI voice assistants.
Table of Contents
The 10 KPIs to track in a healthcare call center in 2026 are: call abandonment rate (CAR), average speed of answer (ASA), first call resolution (FCR), patient satisfaction score (PSAT), booking conversion rate, average handling time (AHT), agent occupancy rate, cost per call handled, no-show rate and retention rate. Together they measure four dimensions: service accessibility, perceived quality, value generated and financial sustainability. If your facility uses an AI voice assistant, three more metrics apply: automation rate, escalation rate and after-hours coverage.
In healthcare, the call center is not just a support service: it is the first point of contact between the patient and the facility, often the gateway to the care journey. Monitoring the right KPIs means ensuring accessibility, reducing the risk of patient drop-off, and delivering a positive experience from the very first phone call.
Every missed call is not just a management issue – it can turn into a patient who gives up on a visit, a checkup, or a treatment. That's why it's important to track what happens in call centers and during patient intake at the front desk through KPIs – Key Performance Indicators. KPIs help identify where patients are being lost, what generates dissatisfaction, and how to optimize processes to turn every call into an appointment.
Why Are KPIs Vital for the Patient Experience?
Measuring and monitoring the right call center KPIs is essential for evaluating service quality and the patient experience. Data shows that many healthcare call centers struggle to keep up with demand.
In the United States, for example, a study of clinics and hospitals found that during peak hours, staff can handle an average of only 60% of incoming calls, with a deficit of approximately 23 operators per 2,000 daily calls. This results in very high wait times: 4 minutes and 24 seconds on average (Source: Top Healthcare Call Center Metrics That Matter).
The phone is still central in 2026. In our analysis of 2,452 conversations handled by the Run2AI Virtual Reception across Italian healthcare facilities in September 2026, 90.8% took place by phone, compared with 8% via web chat and 1.2% via WhatsApp. Measuring the phone channel well means measuring the facility's main front door.
Answering the phone in healthcare is therefore not an organizational detail, but an integral part of care: if hundreds of patients call every day at all hours, the facility must be able to handle those contacts. Otherwise, patients are lost and people may not receive the information or care they need, with negative impacts on their health.
The Key KPIs and Their Market Benchmarks
When it comes to patient experience and customer service quality in healthcare, certain KPIs become particularly relevant. For each one you will find a definition, the formula and, where available, a benchmark with its source. Many benchmarks come from Hyro's The State of Healthcare Call Centers 2023 report, based on a survey of US healthcare call centers: they are a useful reference, but should be adapted to your local context and the size of your facility.
1. Call Abandonment Rate – CAR
Call Abandonment Rate (CAR) is the percentage of inbound calls in which the patient hangs up before speaking with an agent. Every missed call represents a patient who may give up on care or go elsewhere. Abandonment is often caused by long waits or complex IVR systems. According to the Hyro.ai report "The State of Healthcare Call Centers 2023", the average abandonment rate in US healthcare call centers is 16%, almost one caller in six, and 31% of the centers surveyed report rates between 20% and 30%.
How to calculate it: CAR = (calls abandoned before being answered ÷ total inbound calls) × 100.
2. Average Speed of Answer – ASA
Average Speed of Answer (ASA) is the average time a patient waits on the line before an agent answers. The Hyro.ai report finds an average wait of 4.4 minutes in US healthcare call centers, far from the 50-second goal set by the Healthcare Financial Management Association (HFMA). The longer the wait, the more likely the patient is to hang up, with a direct impact on the abandonment rate.
How to calculate it: ASA = total wait time of answered calls ÷ number of answered calls.
3. First Call Resolution – FCR
First Call Resolution (FCR) is the percentage of requests resolved on the first contact, without the patient having to call back or wait for a follow-up. It is a crucial efficiency indicator. According to Hyro.ai, the average in US healthcare call centers is 52% and only 1% of centers achieve an FCR between 80% and 100%, while the good-performance standard set by SQM for healthcare call centers is 70–79%. In practice, roughly one patient in two has to call more than once to get their request resolved.
In 2026, FCR should also be read in light of compound requests: in our analysis each conversation contains on average 2.0 different requests, and a call is truly resolved only when all of them are.
How to calculate it: FCR = (requests resolved on first contact ÷ total requests) × 100.
4. Patient Satisfaction Score – PSAT
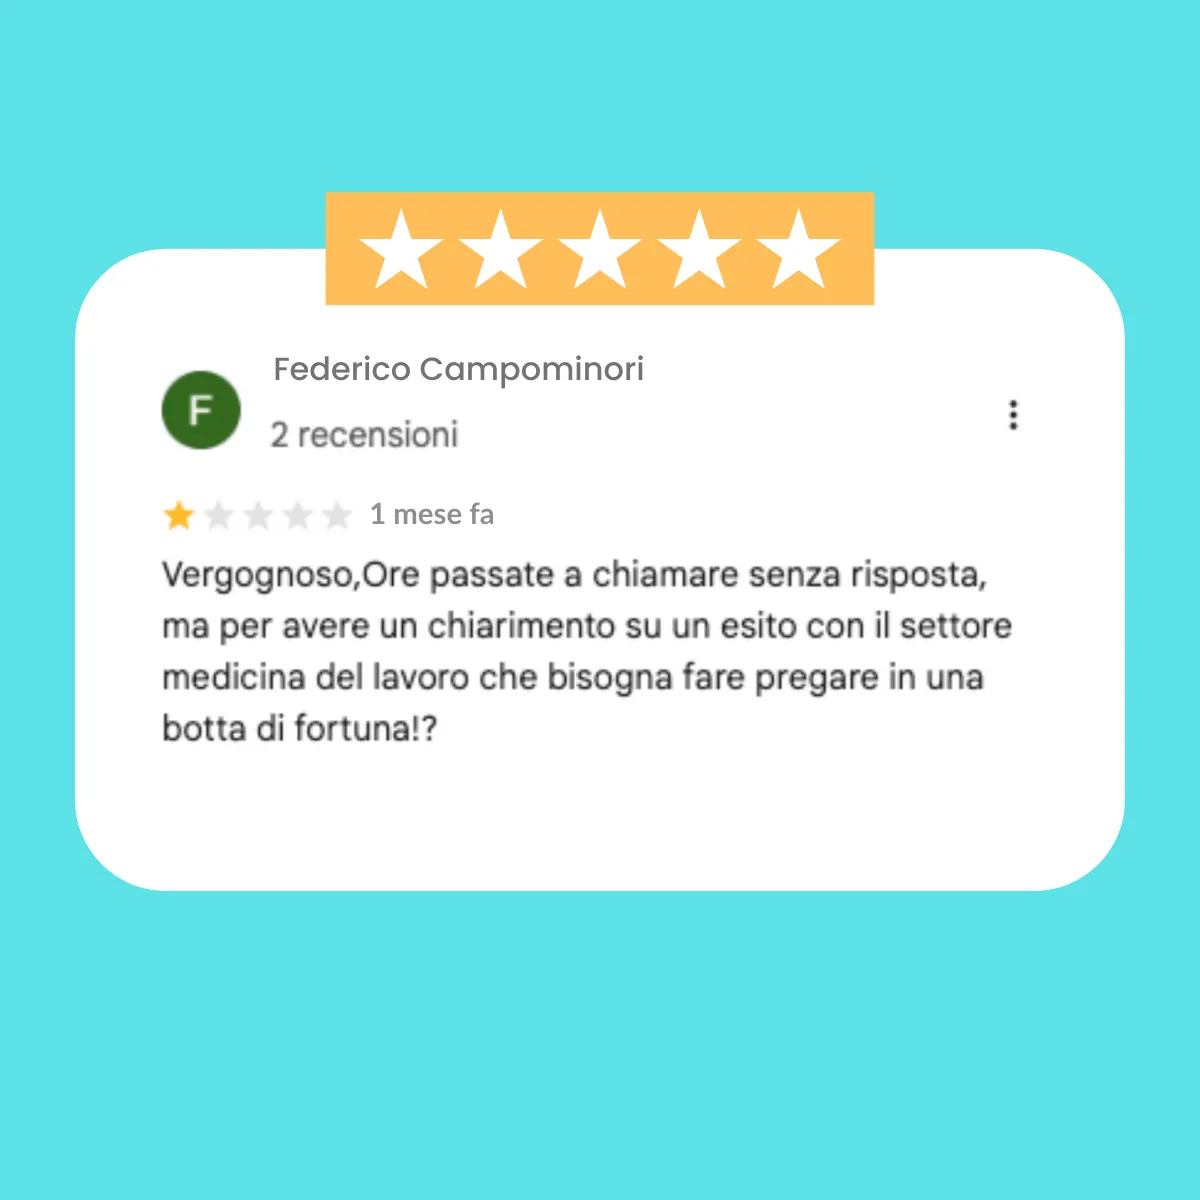
Patient Satisfaction Score (PSAT) is the share of patients who rate their contact experience with the facility positively, and it is the most direct gauge of perceived quality. It is measured with short post-call or SMS surveys and complemented by analysis of online reviews. Rather than chasing an absolute number, set an internal target and track the trend over time: negative reviews often focus precisely on the experience with the front desk and the intake process.
How to calculate it: PSAT = (positive responses ÷ total responses) × 100, counting for example ratings of 4 and 5 on a 1-to-5 scale as positive.
5. Patient Conversion
The patient conversion rate is the percentage of calls with booking intent that end with an appointment actually scheduled. It is a very concrete KPI because it links the call center to the facility's revenue. In our 2026 analysis, booking appears in 68.3% of conversations: it is the main reason patients get in touch, and every booking that is not completed is lost value.
How to calculate it: Conversion rate = (confirmed bookings ÷ calls with booking intent) × 100.
6. Average Handling Time – AHT
Average Handling Time (AHT) is the average time spent handling a call, from answer to wrap-up, including hold time and follow-up admin work. Times that are too short risk lowering quality, while times that are too long create queues and inefficiencies. According to Hyro.ai, the average in US healthcare call centers is 6.6 minutes, and the difference between centers with 100 agents and those with more than 500 is minimal: adding staff alone does not reduce AHT.
How to calculate it: AHT = (talk time + hold time + after-call work) ÷ calls handled.
7. Occupancy Rate
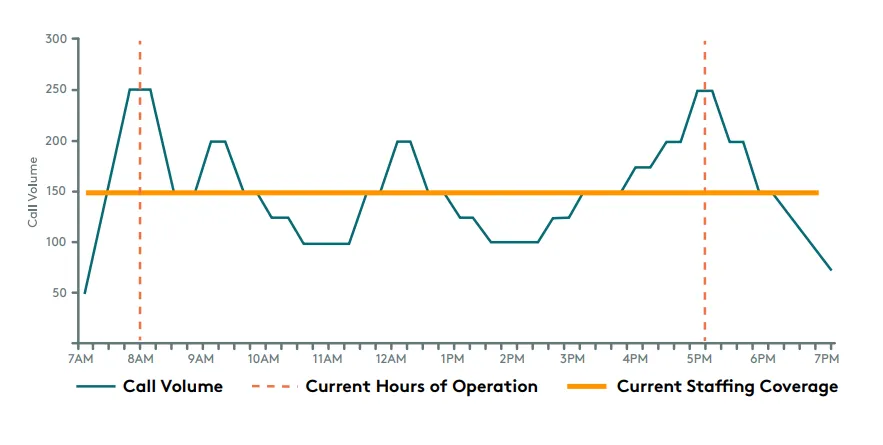
Occupancy Rate is the percentage of logged-in time that agents actually spend on calls and related tasks. A value that is too low signals inefficiency, while one that is consistently too high leads to burnout: several contact center managers surveyed by Call Centre Helper advise against running consistently above 85%. In healthcare call centers, however, staff can often handle only 60% of incoming calls during peak hours, because agents have to manage several channels at once. At these times it becomes crucial to add resources during peaks and extend service hours.
How to calculate it: Occupancy rate = (time spent on calls and related tasks ÷ total logged-in time) × 100.
8. Cost per Call Handled
Cost per call handled is the average cost the facility incurs for each call, and it is the key indicator of financial sustainability. It includes every cost of the service: staff salaries, technology, energy, space and training. The Hyro.ai report puts the average cost per call in US healthcare call centers at $4.90, with 8% of centers between $10 and $15.
How to calculate it: Cost per call = total service costs for the period ÷ calls handled in the period.
9. No-Show Rate
The no-show rate is the percentage of appointments the patient misses without cancelling. In healthcare it directly affects both clinical scheduling and the facility's financial sustainability: every missed appointment is lost clinician time and a service that never reaches the patient. The call center plays a decisive role: a systematic review published in BMC Health Services Research in 2023 identifies SMS, phone and mail reminders as the most-studied intervention for reducing missed appointments, with evidence of effectiveness across several departments, although results vary between studies. Phone reminders and SMS confirmations free up slots that can be reassigned to other patients. Making cancellation easy matters just as much: in our 2026 analysis, 9.5% of conversations concern changing or cancelling an appointment, and a cancellation that cannot get through risks becoming a no-show.
How to calculate it: No-show rate = (appointments missed without cancellation ÷ scheduled appointments) × 100.
10. Retention Rate
The retention rate is the percentage of patients who book again at the same facility within a given period, and it measures the medical center's ability to retain patients by maintaining a relationship over time. High retention signals satisfaction and trust; a sudden drop is often the first sign of problems with access or service quality.
How to calculate it: Retention rate = (patients from the previous period who booked again ÷ patients from the previous period) × 100.
Source: Envera Health – Access Healthcare
The 10 KPIs at a Glance: Formulas and Why They Matter
The table summarizes the formula for each indicator and why it is worth tracking. Reference values, where available, are given in each section together with their source.
| KPI | Formula | Why it matters |
|---|---|---|
| Call abandonment rate (CAR) | Abandoned calls ÷ inbound calls × 100 | Measures patients lost before they even reach the facility |
| Average speed of answer (ASA) | Total wait time ÷ answered calls | Long waits are a leading cause of abandonment |
| First call resolution (FCR) | Requests resolved on first contact ÷ total requests × 100 | Reduces repeat calls and agent workload |
| Patient satisfaction score (PSAT) | Positive responses ÷ total responses × 100 | Measures perceived quality and drives online reputation |
| Conversion rate | Confirmed bookings ÷ calls with booking intent × 100 | Links the call center to facility revenue |
| Average handling time (AHT) | (Talk + hold + after-call work) ÷ calls handled | Balances efficiency and quality of the conversation |
| Occupancy rate | Time on calls and related tasks ÷ logged-in time × 100 | Prevents both inefficiency and burnout |
| Cost per call | Total service costs ÷ calls handled | Measures financial sustainability |
| No-show rate | Appointments missed without cancellation ÷ scheduled appointments × 100 | Protects clinical schedules and revenue |
| Retention rate | Patients who book again ÷ patients from the previous period × 100 | Measures loyalty over time |
KPIs for AI Voice Assistants in 2026
In 2026 more and more facilities pair their agents with an AI voice assistant or a Virtual Reception. The 10 KPIs still apply, but three additional metrics are needed to assess the automated part of the service.
Automation Rate (Containment Rate)
The automation rate is the percentage of conversations the AI assistant resolves end to end without an agent stepping in. Measure it by request type, because bookings and informational questions have very different automation levels. In Run2AI deployments, the Virtual Reception autonomously handles up to 15–20% of bookings or appointment changes and resolves 20–25% of informational requests, while a traditional IVR stops at 10–15%, limited to basic information such as opening hours (Run2AI data, 2026; more in IVR vs Virtual Reception: pros and cons).
How to calculate it: Automation rate = (conversations resolved without an agent ÷ conversations handled by the AI assistant) × 100.
Escalation Rate
The escalation rate is the percentage of conversations the AI assistant transfers to a human agent. It should not be driven down at all costs, because some requests must reach a person, but it is worth distinguishing between requested and necessary escalation. In our conversation analysis, a request to speak with an agent appears in 30.4% of cases, but it is the only request in just 6.3%: in 79.2% of cases it comes with a concrete need, such as a booking, that the assistant can often handle directly.
How to calculate it: Escalation rate = (conversations transferred to an agent ÷ conversations handled by the AI assistant) × 100.
After-Hours Coverage
After-hours coverage is the percentage of contacts received while the facility is closed (evenings, nights, weekends and holidays) that are handled rather than lost. It is the KPI that most directly measures the value of a 24/7 service. According to the Hyro.ai report, only 19% of US healthcare call centers operate 24/7, while across 300,000 interactions analyzed about 11% of patients call after hours or on weekends.
How to calculate it: After-hours coverage = (after-hours contacts handled ÷ after-hours contacts received) × 100.
Conclusions
Monitoring the 10 KPIs described is not an academic exercise: it's the only way to know if your healthcare call center is effective for patients and sustainable for the facility.
With indicators like abandonment rate, average wait time, and FCR, you can intervene quickly to improve the phone experience. With metrics like conversion, avoided no-shows, and retention, you measure the real value created: how many patients become paying clients and how many return. Finally, with AHT and cost per call — including with an AI virtual receptionist for healthcare — you understand whether the model is economically sustainable.
If you use an AI voice assistant, add automation rate, escalation rate and after-hours coverage to these indicators: they show how much of the workload is truly absorbed and where the human touch is still needed.
We recommend setting realistic targets for each KPI, measuring them on a regular basis, and comparing them with industry benchmarks. Numbers alone are not enough: root cause analysis and corrective action are also needed.
A healthcare call center that answers quickly, resolves issues on the first contact, and fosters retention is not just a service: it's an integral part of patient care – and can become a competitive advantage for the facility.
Frequently Asked Questions
What are the most important KPIs to monitor in a healthcare call center?
The ten key indicators are: Call Abandonment Rate, Average Speed of Answer, First Call Resolution, Patient Satisfaction Score, patient conversion rate, Average Handling Time, Occupancy Rate, cost per handled call, no-show rate, and Retention Rate. Together they measure service accessibility, perceived quality, economic value generated, and model sustainability.
What is an acceptable call abandonment rate in healthcare?
There is no single threshold, but industry data offers a reference point: according to Hyro's The State of Healthcare Call Centers 2023 report, the average abandonment rate in US healthcare call centers is 16%, almost one caller in six, and 31% of centers report rates between 20% and 30%. Every abandoned call is a patient who may forgo care or turn to another facility, so the goal is to keep it as low as possible and monitor it closely during peak hours.
How quickly should a healthcare call center answer?
The Healthcare Financial Management Association (HFMA) sets a goal of a 50-second wait, but according to Hyro's 2023 report the average in US healthcare call centers is 4.4 minutes. The longer the wait, the more likely the patient is to hang up before getting an answer.
How can the call center reduce no-shows?
With phone reminders and SMS confirmations before the appointment, which a systematic review published in BMC Health Services Research in 2023 identifies as the most-studied intervention against missed appointments, and by making it easy to cancel. Freed slots can be reassigned to other patients, improving the facility's overall productivity.
Which KPIs should you use to measure an AI voice assistant in a healthcare call center?
Beyond the 10 traditional KPIs, three metrics are needed: automation rate (conversations resolved without an agent), escalation rate (conversations transferred to an agent) and after-hours coverage (contacts received while the facility is closed and handled). In Run2AI deployments, the Virtual Reception autonomously handles up to 15-20% of bookings or appointment changes and resolves 20-25% of informational requests.
Related Articles
4 Examples of Artificial Empathy in AI Assistants

Explore how chatbots and voicebots can simulate empathy in customer service, with real-world examples in healthcare, banking, tourism, and HR.
Read moreCyber Attacks in Healthcare: Escalation and Countermeasures

Analysis of the escalation of cyber attacks in the Italian healthcare sector, with prominent cases, common attack vectors, and practical solutions to strengthen cybersecurity.
Read more